


Introduction
Natural disasters have posed serious threats to lives and properties particularly in large urban areas. The occurrence of disaster events such as typhoons, earthquakes, winter storms has resulted in geospatial researchers seeking different methods and techniques to visualize the events. In addition, researchers have sought to understand and predict human movement in order to plan for disaster evacuation, response, and relief. This project will examine and visualize the location of different disasters in the world using individuals' movement data collected from Twitter.
Data Source
The data titled Human Mobility During Natural Disasters was provided by two authors (Wang & Taylor, 2016) and was downloaded from Kaggle - a platform for sharing data with researchers and developers. The dataset has the following fields: disaster.event, user.anon, latitude, longitude.anon, time. The fields describe the different types of disaster events; the anonymous id of the twitter account users, the latitude of the users tweet; the longitude of the user's tweet; the time of the tweet respectively.
Getting started with the project
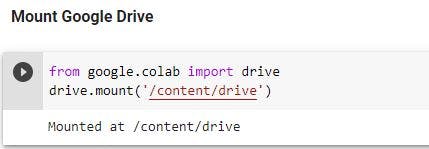
Using Google Collaboratory (colab), we will connect our drive in a Python file -Geovisualization. This can be done by using the code below
from google.colab import drive
drive.mount('/content/drive')
Importing relevant libraries
In order to read, analyze and visualize our dataset, we will import the necessary Python packages
import numpy as np
import pandas as pd
import matplotlib.pyplot as plt
import seaborn as sns
sns.set()
import statsmodels.api as sm
Read the csv file
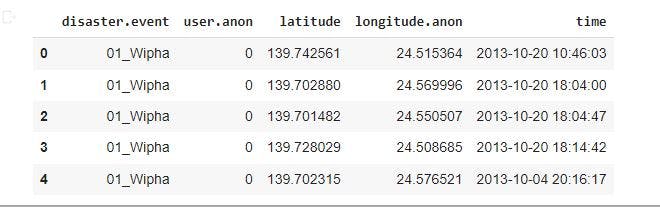
The data is stored inform of a csv file. We will convert the file to a pandas data frame in order to read it and print the first five rows.
raw_data = pd.read_csv('natural_disaster_human_mobility.csv')
raw_data.head()
Descriptive statistics of the data
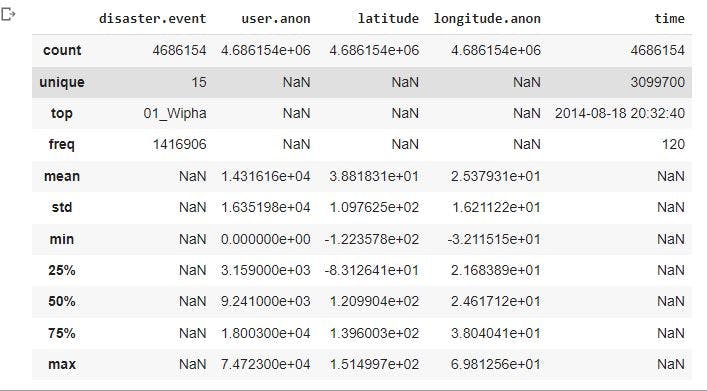
We will have a summary of our dataset to understand the features available
raw_data.describe(include='all')
The image below shows we have 15 unique disaster events which several users tweeted about. These tweets were also made at different time on Twitter.
Copy the raw data
We will copy raw_data which contain our data. This was done to avoid manipulating the original data. We will also check the shape of the copied dataset.
data=raw_data.copy()
data.shape
The image below shows we have 4686154 tweets on certain disaster events with 5 columns.

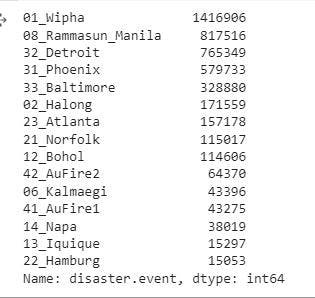
Count tweets related to unique disaster events
We will calculate the amount tweets made by the users in relation to the unique disaster events.
data['disaster.event'].value_counts()
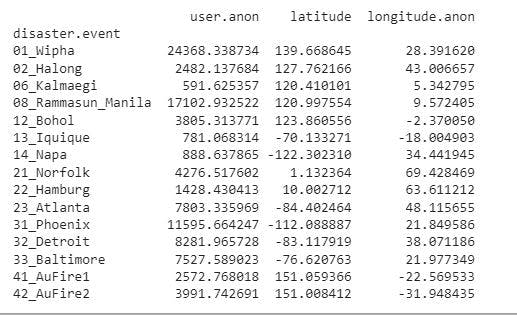
Group and plot the location of disaster events
We will group the data by unique disaster events using the average and then plot each disaster location on a scatter plot.
# To group the data
data_group = data.groupby(data['disaster.event']).mean()
print(data_group)
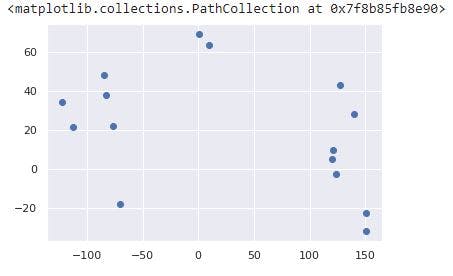
To plot the grouped data:
plt.scatter(data_group.latitude, data_group['longitude.anon'])
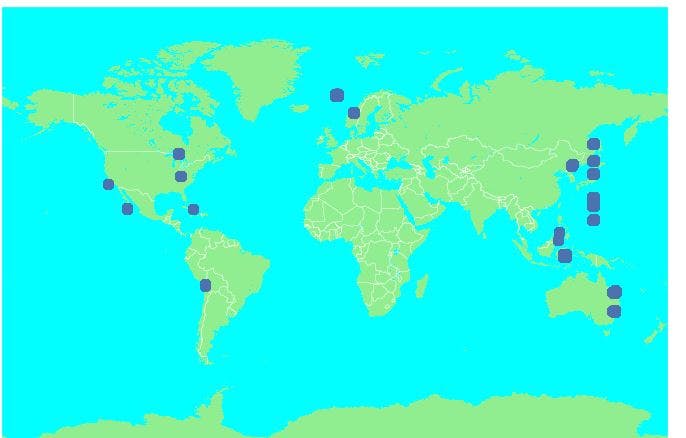
Disaster events geovisualization
In order to geolocate the disaster events, we will install base map.
!pip3 install basemap
and then import:
from mpl_toolkits.basemap import Basemap
import matplotlib.pyplot as plt
Creating the base map
We will make a base map with the
fig= plt.figure(figsize=(12,9))
m=Basemap(projection='mill',
          llcrnrlat=-90, # Lower left corner latitude
          urcrnrlat=90, # Upper right corner latitude
          llcrnrlon=-180, # lower left corner longitude
          urcrnrlon=180, # upper right corner longitude
          resolution='l') # Resolution set to low

m.drawcountries(color='white) # Show countries
m.drawlsmask(land_color='lightgreen', ocean_color='aqua', lakes=True) # set color of land and water bodies
view_list = m(data["latitude"].tolist(), data["longitude.anon"].tolist()) # Convert longitude and latitude from pandas frame to a list

m.scatter(view_list[0], view_list[1], s=100, zorder=2) # Plot the latitude and longitude
plt.title('Disaster Geolocation Visualization', fontsize=20) #  Set map title
plt.show()
Conclusion
The application of machine learning techniques to understand disasters in human environment is increasing in research studies. Geospatial data scientists are focused on making the environment more sustainable and livable. Thus, getting the location of disaster events is an integral step towards preparing and reducing the large scale effects of disasters. Thank you for reading and I am looking forward to seeing you read my project on multi-class land cover classification with deep learning techniques.
Reference for the original data source used
Wang Q, Taylor JE (2016) Data from: Patterns and limitations of urban human mobility resilience under the influence of multiple types of natural disaster. Dryad Digital Repository. dx.doi.org/10.5061/dryad.88354